HOW MUTATIONS INTERACT
A story about anchovies with chocolate, bad work days, and mutations in yeast
Based on a paper called "Higher-fitness yeast genotypes are less robust to deleterious mutations"
Original paper & preprint by Milo Johnson, Alena Martsul, Sergey Kryazhimskiy, and Michael Desai
INTRO
We intuitively understand interactions in human-built systems better than in biological systems
The effects of a change depend on the circumstances.
Wow what a meaningless first sentence! Let's back up...
Adding chocolate to a recipe will be good for some recipes but disastrous for others. If a soccer team with an excellent goalkeeper picks up a good goalkeeper it will have less impact than if a team with only poor goalkeepers makes the same trade. The decision to offer expedited delivery will affect large and small retailers differently. So we clearly all understand that when we make changes to the systems in our everyday lives, the results depend on the characteristics of those systems. And, as biologists have known for over a century, a mutation may cause a particular physical change in one strain and a completely different change in another closely related strain. These “background-dependent” effects result from the fact that all of these systems have interacting parts, and we call these interactions EPISTASIS.
When we try to improve the systems in the human-built world – sports teams, companies, recipes, cities – we have strong intuition about these interactions. We understand that in optimizing a process we may face diminishing returns, so that changes that might have been impactful at an earlier stage will not contribute meaningfully later on. When we are working on improving a recipe, we understand specific interactions - chocolate works well with peanut butter, but not necessarily with anchovies (source, but also see this counterpoint).
We can think about research on epistasis as an attempt to build this kind of intuition in biological systems. What determines how much a mutation affects a particular strain or genotype? When will interactions be broad (i.e. a good soccer player will have a bigger impact on a worse team) or specific (i.e. adding lime will be a better choice if there is already cilantro in the recipe)?
So how do we gain intuition about how the effects of mutations depend on the genetic background? We put on our science clothes (ok just regular clothes except no sandals) and put as many mutations into as many genetic backgrounds as we can, and then measure all their effects! Simple as that.
WHAT DID WE DO?
Put a bunch of mutations into a bunch of yeast and measured their fitness effects
OK not quite as simple as that. There are many methods available for engineering mutations in animals, plants, and microbes. Our particular choices were made largely based on convenience. Our lab studies the budding yeast Saccharomyces cerevisiae, which rose to fame centuries ago as a handy bread and beer maker, and then later as the easiest eukaryote to play with in the lab. A few facts about S. cerevisiae that matter here:
- They can generally divide about once every 90 minutes (though this is different for different strains), so we can dilute them 1/1024 each day and they can divide 10 times to get back (2^10=1024) to their starting density.
- They are really good at repairing their DNA using pieces of similar DNA by homologous recombination. This means that if we put a piece of DNA into the cell that lines up with a part of the genome, it will sometimes (very rarely, but still commonly enough to be useful) replace that part of the genome. (Click on the picture to look through the slideshow-graphic below).
- They smell better than bacteria (OK this isn’t that important, just sayin).

Alright so we want to put a lot of mutations into a lot of yeast strains. To make mutations, we used a plasmid-based transposon insertion library that other scientists made years ago (protocol, paper). These plasmids have a backbone, a section of the yeast genome, and a transposon that interrupts that section. What I did is take this existing library, sample a smaller set of plasmids from it (which correspond to a set of insertion locations in the yeast genome), and add random DNA barcodes into the inside of the transposon.

These barcodes identify each different insertion/mutation uniquely, and when I put them into yeast later, I can track the frequencies of barcodes by sequencing. In order to make these barcoded libraries, I came up with / improved a few fun methods that you can read more about if you’re into that kind of thing (NOTE: I'm serious, don't click if you don't care! My personal bad habit is to click anything I can click, but the idea is for these dropdowns to be super-optional, so if you don't care about sequencing transposon edges etc. resist the urge to click!)
Reading the transposon edge with “TagMap” sequencing
In order to identify particular insertions in yeast genomic DNA in our plasmid libraries, we need to sequence from a known region, the inside of the transposon, into an unknown region, the yeast genome outside the transposon. This is tricky because we don't have a PCR primer that will magically work for the unknown region. People have invented a few different ways to deal with this problem, including a neat trick with a restriction enzyme that works on one type of transposon edge (Mme1, see this paper), but we used a different method: one that uses ... you guessed it - another transposon! This engineered transposon, or "tagmentase," randomly inserts into our plasmids. Some fraction of the time, it inserts near the transposon edge, and we can do a pcr between the transposon in the plasmid and the one we just inserted, reading the yeast genomic DNA in between. This process has been used for whole genome sequencing for a while, but there are only a few papers describing doing it for this kind of edge-sequencing (this "TagMap" paper describes the method well, BUT we were also able to make it work using the commercially available Tn5, which might be easier for many labs!).

Identifying many plasmid identities at once using Cartesian-pooling coordinate sequencing
In order to build the plasmid libraries we used in this project, we needed to isolate and identify a ton of individual plasmids (identify which section of the yeast genome is inside the plasmid and where the transposon insertion is in that section of yeast genome). To do that without having to sequence hundreds or thousands of plasmid-bearing strains individually, we use a nifty trick called "coordinate sequencing", where we sequence pools of plasmids from rows, columns, plate-rows, and plate-columns of a set of 96 well plates. We pool and sequence everything in row A of all plates, Row B or all plates, etc., we pool and sequence everything in column 1 of all plates, column 2 of all plates, etc., and then we make pools of all wells of each plate ("plate pools") and arrange these pools in a grid as well, so we can pool and sequence everything from row A etc. and column 1 etc. of this grid. Then when we get all the sequencing results back, if we see a particular insertion in the yeast genome (I call these "edges" since they are the nucleotides next to the transposon edge) in the Row A pool, Column 2 pool, plate-row B, and plate-column 1, we know that plasmid is in plate 2, well A2 (two papers that describe this method:1, 2, preprint)

Why redundant barcoding is the best
When we add barcodes to the plasmid libraries, we end up with the same plasmid (the same insertion mutation) labeled by many different barcodes. This is useful for two important reasons:
1. In each transformation there are multiple barcodes per insertion mutation, so if we get enough transformed cells, we will get multiple replicate barcodes for each mutation in our assay. This is great because when you transform cells, sometimes they come out weird, either because they get an additional mutation during the process or there was already a mutation in the population of cells you're transforming. If, for example, this "artifact" causes them to be more fit than they should, those cells will rise in frequency and you'll measure the fitness totally wrong. With only one barcode per mutation, we have no way to avoid this issue except by doing many replicate transformations and assays, which is a pain. With multiple barcodes per mutation we can see these outliers, and try to identify and exclude them. Which is super nice. BUT WAIT THERE'S MORE. We can also repeat the barcoding process multiple times, to make separate plasmid libraries with the same set of mutations but with different barcodes. When we do the TagMap sequencing to match up barcodes with mutations, we can also match them up with these separate libraries. Then when we transform different yeast strains with these libraries and do competition assays, we can pool the cells together for DNA extraction and library preps - and eventually split the data up based on which barcodes are in which library. This means we can cut our DNA extraction and library prep load X times, where X is the number of libraries, so for this last experiment I did 20 preps instead of 1760. FIVE STARS, WOULD USE REDUNDANT BARCODING AGAIN WHENEVER POSSIBLE IT IS SO GREAT.
Next, I cut the sections of the yeast genome out of the plasmid libraries (all the different plasmids are pooled together at this stage) and transformed them into some yeast strains. These strains are the offspring from a mating between a wine strain and a lab strain, and they differ at tens of thousands of positions across their genome. Lucky for us, researchers in Leonid Kruglyak’s lab had already sequenced all of these strains (they also did the cross in the first place! (paper, data)), so I already knew whether they had mom's or dad’s allele at each one of these loci.
I grew each of these pools of mutant yeast (one strain, but with many different insertion mutations) for four days, letting all the mutations compete against one another in an all vs. all THUNDERDOME showdown. Each day, I pooled together cells after the daily dilution, extracted DNA, and amplified the barcode region with PCR (nice to write that in a such a simple way, in reality Alena Martsul (collaborator from UCSD) and I had many back-and-forths on skype to figure out how to get our PCRs to work well!). Once we sequenced these amplified fragments, we could measure the frequency of each of the mutations over time, and by watching which mutations went up or down over the 4 days (and by how much), we could measure the fitness effect of each mutation in each strain.
WHAT WE FOUND
Mutations interact in a variety of ways, but are usually more deleterious in strains that start out more fit
1. It is hard being fit.
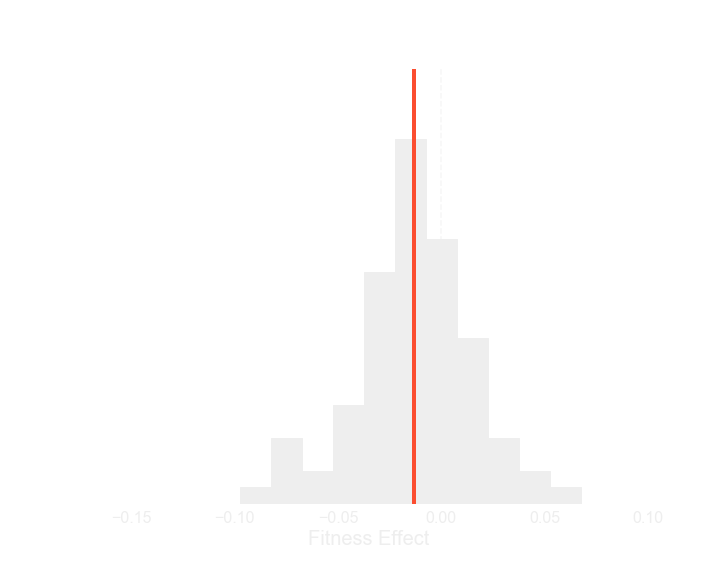
If we look at the distribution of fitness effects of all the mutations, strains that start out better (that are more fit, that grow faster), have worse options - the drawing below shows the basic features of this distribution of fitness effects, and the graph shows a real distribution from one strain in the experiment - you can move the slider at the bottom to see how the distribution changes as you scroll through the list of strains, which are sorted from least fit to most fit. Each individual distribution is a little noisy, but you should be able to see the mean, indicated by a red line, shift to the left as you slide towards more fit strains.

Least fit segregant
Most fit segregant
2. For individual mutations, there are a ton of different patterns of interactions (epistasis)!
In the plots below, each point represents the fitness effect of a particular mutation in one strain. Its x-axis value represents the starting fitness of that strain (how well it grows to begin with), and its y-axis value represents the fitness effect of the mutation (positive values mean it is beneficial, negative means deleterious). Click through the slideshow below to see graphics of some of the patterns of epistasis we observe, such as diminishing returns (when a mutation is less beneficial in strains that start out more fit) and increasing costs (when a mutation is more deleterious in strains that start out more fit)

Below is a data browser where data for each insertion mutation is shown in a separate graph, sorted by variance in fitness effect.
- Click on a plot to see more about that mutation
- If the mutation's fitness effect depends on whether the strain has mom's or dad's allele at some specific loci, we change the color or shape of the points to represent the different alleles at these loci (only the two most important are shown if there are more than two)
- Click on a point to see the barcode frequency data that we used to measure that fitness effect
- Links in the mutation description go to the awesome SGD website that has tons of extra yeast genetics info!
Interactive data browser (click to expand, may take a while to load/run)
Looking at all of these mutations, we can see that most correlations between background fitness and the fitness effect of one mutations are negative - mutations tend to be worse in strains that start out better. This helps explain the shifting distributions we saw above. BUT (AND THIS IS INDEED A BIG IMPORTANT BUT) not all mutations have simple negative correlations - some are the opposite, some have similar effects across genetic backgrounds ("low epistasis"), and others have interactions with specific QTLs (interactions with mutations that differentiate the two parents of the yeast cross). Still, there are a ton of cases of "increasing costs," where mutations are more deleterious in more fit strains. I like to think of this pattern through... SURPRISE, a metaphor:
Let's say you work in an office as part of team that produces something cool (let your imagination run wild), and this team is a WELL-OILED MACHINE! Everyone is communicating seamlessly, working efficiently, and production is high. Then you have a bad day. Maybe you stayed up too late the night before, maybe you're distracted by something in your personal life, maybe you're just in an unexplainable painful slump. Since everyone else is so efficient, your bad day is likely to cause a big slow down in production. Now imagine that instead the team is a disaster to begin with. Nobody is communicating, several people are painfully slow at completing their tasks, and you finish your work with time to spare every day. In this case your bad day might not matter at all! Note that if we apply this metaphor to some of our data, where our negative correlations cross zero, having a bad day as part of a bad team sometimes even improves overall productivity - this definitely strains the metaphor a bit, but it is an interesting observation for which we don't really have any good explanation as of now!
THE KEY REMAINING QUESTION
Why do different mutations follow different patterns of epistasis?
There are many follow-up questions to our study involving how applicable it is to other systems – would this be true in other strains or species, in other environmental conditions, with other types of mutations? These are interesting questions and I think we should do some of these experiments (and we’re working on some things in this direction now!), but of course we can’t test all types of mutations in all species, so there is a more fundamental goal: link these results to our understanding of biological systems, so that we can predict how mutations will interact. In the human-created systems around us – sports teams, recipes, manufacturing pipelines – we are constantly predicting interactions, sometimes based on large aggregate variables we can observe (how good a team already is, how spicy a dish already is, what the daily output of the pipeline is), and sometimes based on specific observables (a particular player, ingredient, machine). We see both interaction types in our data: strong correlations between fitness effects and background fitness, as well as specific interactions between insertion mutations and QTLs. When should we expect to see each of these patterns of epistasis?
Because cells are small chemical machines that have been evolving for billions of years, our intuition about interactions within them is not as good as our intuition for systems we built ourselves. But hopefully by combining high throughput mutagenesis experiments with careful modeling of cellular processes, biologists can get a taste of the intuition that a manager uses to improve a supply chain, that a chef uses to perfect a recipe, or that a pair of sports radio pundits use to analyze the latest disastrous trade.
THE END
Links to explore the data and discuss the paper
Try analyzing the data yourself using this binder, or download data to analyze on your own computer.
Comments and discussion are held in the twitter-world here:
A science communication experiment I worked on this winter and finally put online: a (hopefully) readable story about epistasis, with "clickable depth," and interactive data browsing https://t.co/cfxC9Gm0vv
— Milo Johnson (@_miloj) August 22, 2020
Based on work w @MichaelMDesai, @skryazhi, and Alena Martsul pic.twitter.com/Kg3vgSyDck